
This visual Data Story is based on findings from the 2023 Annual Survey of Museum-Goers, a national survey of American museum visitors from AAM and Wilkening Consulting. Every year, the survey partners with individual museums to research their audiences and yield insights about their behaviors and preferences, both on an institutional and national level. Interested in joining the 2024 edition on the themes of repeat visitation, imagination, and hope for the future? Sign up by February 28, 2024, for a special early bird rate.

When we look at visitation gaps among the broader population, there are two big things to consider: Incidence and Frequency.
Incidence is a binary yes/no question: has someone been to a museum (of any type) in the past year? We measure incidence by doing broader population sampling among US adults.
Frequency is different, and looks at how often someone has been to museums in a defined time period.
Typically, when we ask about museum visitation in the broader population, we ask if respondents have visited in the past year. In 2021 and 2022, we switched to two years, and in 2022, 37% of respondents said they had visited a museum. In 2023, however, we went back to one year, and the percentage fell to 28%…smack in the middle of pre-pandemic norms of 25 – 31%.
When we field the Annual Survey of Museum-Goers, the respondents are overwhelmingly frequent museum-goers. Our simplified definition of these individuals is that they are engaged enough with one (or more) museums to be on a communications list (email, social media, etc.) and then complete a survey on a museum’s behalf. We do assess their frequency, and virtually all respondents are what we would define as frequent museum-goers.
When we plot out certain demographic characteristics, we find that who visits museums frequently (and the gaps we discover) can be very different than who visits museums at all (the incidence). That is, the demographic profile of frequent museum-goers is a bit different than the profile of all museum-goers, especially casual and sporadic visitors.
Understanding these gaps (and where gaps don’t exist) is important, because it gives us a much more nuanced understanding of who museums are reaching, and how deeply.
There are three demographic factors that we want to examine more completely.
Educational Attainment
Among frequent museum-goers, 82% of respondents have a college degree; that’s 2.6x the rate of college degrees among US adults (32%).
From that, it would be easy to conclude that museum-goers are much more likely to have college degrees than the public. But that’s not totally true. A more accurate statement would be that frequent museum-goers are much more likely to have a college degree…a frequency gap, not an incidence gap.
When we look at incidence, we do find that people with a college degree are more likely to have been to a museum in the past year than other US adults, but those with some post-secondary education are right on their heels. The true incidence gap is with those with a high school diploma/GED or less.

Race and Ethnicity
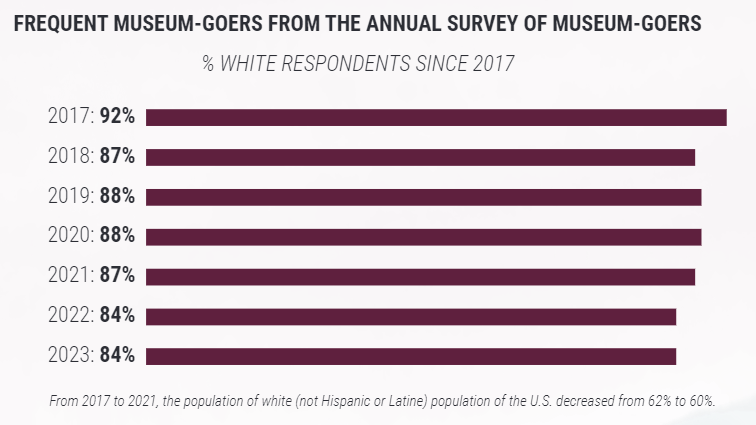
Among frequent museum-goers, 84% say that they (or a member of their household) identify as white. In contrast, 59% of people living in the United States identify as white (not Hispanic or Latine).
Again, it would be easy to make a big assumption here. But the accurate conclusion from this is that yes, frequent museum-goers are significantly more likely to identify as white than the broader population.
Incidence tells a very different story. In 2023, for the second year in a row, white people were no more likely to have visited a museum than people of color. White people and African Americans are similarly likely to have been to a museum in the past year, Hispanics or Latines are slightly more likely, and Asian Americans are the most likely.

Surprised? Last year we were too! We had been seeing the incidence gap closing over the past few years, but we didn’t necessarily think that 2022 would be the year it would disappear (or that Asians and Asian Americans would be the most likely to visit). The fact that the numbers held for a second year gives us further confidence that this is a trend, not a fluke.
A victory lap? Not so fast! Incidence gaps do still persist by museum type and for specific museums.
By museum types, historic sites in particular have persistently high incidence and frequency gaps, with audiences still, overall, skewing disproportionately white.
Additionally, this still varies widely for individual museums. Your museum may still be facing an incidence gap, and only research specific to your museum can help you understand where your gaps are (or are not).
The frequency gap we see by race and ethnicity is incredibly persistent, but we have some good news here as well. Since 2017, it has been decreasing, albeit slowly.
Age and Life Stage
Some museum types deliberately focus on families with minor children (children’s museums and, to a lesser extent, zoos, aquaria, and science centers), and these museums don’t tend to see frequency gaps (or incidence gaps) by age that are of significant concern…though they often see frequency gaps with young adults without children.
But it is a different story for art museums, history organizations, and botanical gardens. It is incredibly common for the majority of their frequent museum-goers to be over the age of 60.
This, understandably, can cause a great deal of concern for people working in these types of museums. And that’s why looking at incidence is so important.
It turns out, however, adults over 60 are the least likely segment of the population to visit museums (a pattern we have seen pretty consistently over the past several years). We actually underserve them.

Additionally, those casual and sporadic young adult visitors visit most museum types, lagging behind the overall average only for children’s museums and zoos/aquaria (largely because, well, they don’t have children; this shifts when some of them start families, of course!).
But overall, at this time, we don’t have significant concerns about the long-term pipeline of future visitors to museums of any type.
Annual Survey of Museum-Goers Data Stories are created by Wilkening Consulting on behalf of the American Alliance of Museums. Sources include:
- 2023 Annual Survey of Museum-Goers, n = 107,187; 228 museums participating
- 2023 Broader Population Sampling, n = 2,002
- 2017 – 2022 Annual Surveys of Museum-Goers
*Data Stories share research about both frequent museum-goers (typically visit multiple museums each year) and the broader population (including casual and non-visitors to museums). See the Purpose and Methodology (Update) Data Story from September 12, 2023 for more information on methodology.
More Data Stories can be found at wilkeningconsulting.com/data-stories.
[inset-related-content]






I am working on a book about the building category and am interested in determining lifetime percentages or number of visits for the US population. Does your analysis include information on how often viewers visit a museum over a lifetime. For example, do you know if a certain percentage of people never visit a museum, only once, and so on? Thanks!