This visual Data Story is based on findings from the 2024 Annual Survey of Museum-Goers, a national survey of American museum visitors from AAM and Wilkening Consulting. Every year, the survey partners with individual museums to research their audiences and yield insights about their behaviors and preferences, both on an institutional and national level. Interested in joining the 2025 edition on the themes of repeat visitation, social connection, and community trust and responsibility? Sign up by February 28, 2025, for a special early bird rate.

Over the past several years, race and gender have received extraordinary attention. “Me too” conversations, racial reckonings, and conflict over how gender is expressed have resulted in shifts in inclusive attitudes…some towards a more inclusive viewpoint, and others less so.
Since 2021, we have been tracking how museum-goers feel about inclusive content in museums.
We use a battery of three questions to assess individual attitudes on inclusion, as there is no single question that helps us sort this out accurately. To learn more about the three questions we use, see our 2021 Data Story “The Spectrum of Inclusive Attitudes: Methodology.”
Overall, the news is good: most people want museums to share inclusive content, and inclusive attitudes strongly outnumber the anti-inclusive.
Frankly, it’s also been a bit of a roller coaster ride.
Let’s first examine frequent museum-goers and their attitudes.
Back in 2021, we found that just over half of museum-goers fell on the “inclusive” side of the spectrum, and about a quarter fell on the “anti-inclusive” side.
2021 – FREQUENT MUSEUM-GOERS

In 2022, we were surprised to see that attitudes had shifted quite a bit towards inclusion: nearly 2/3 falling on the more inclusive side and a small dip in anti-inclusive sentiment.
2022 – FREQUENT MUSEUM-GOERS

Over the past two years, however, we seem to have reverted back to 2021 norms, and 2022 increasingly looks like an outlier year.
2023 – FREQUENT MUSEUM-GOERS

2024 – FREQUENT MUSEUM-GOERS

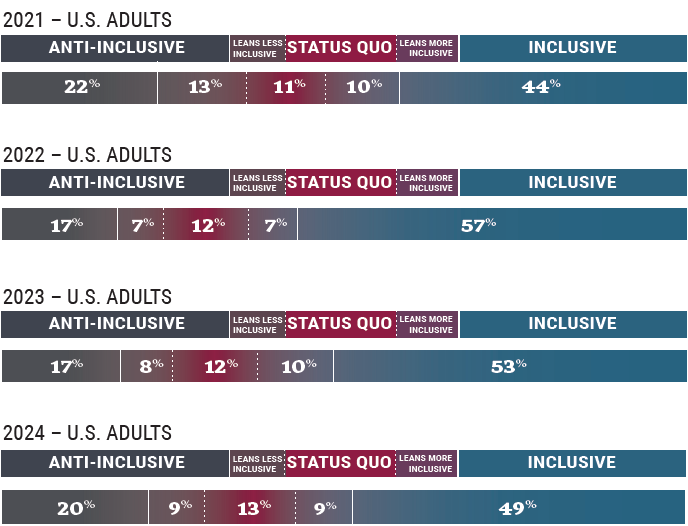
We saw a similar shift of attitudes when we asked a representative broader population sample of U.S. adults the same questions.
Broader Population

For the broader population, inclusive attitudes have not fallen back to 2021 levels, unlike attitudes of frequent museum goers. Indeed, at least a small amount of growth toward inclusivity was maintained there.
So, what’s going on?
Honestly, we don’t know for sure. We can’t go to an individual person and ask why their attitudes are shifting, much less thousands of respondents.
We think, however, this pullback from 2022 may be a result of fatigue. Fatigue from the intense emotions these topics evoke. Fatigue from the political cycle. Fatigue from the many challenges we each face on a daily basis.
When people are tired, they look for respite, comfort, and norms that may make them feel more comfortable. But comfortable for whom? And at whose expense?
And if such fatigue prompts a turn away from inclusive attitudes, how might we do this work effectively? Sharing humanity’s history, experiences, and cultural and artistic expressions is at the heart of what museums do.
The 2025 Annual Survey of Museum-Goers and Broader Population Sampling will field these questions yet again, so we can continue to track this journey we are all taking together.
In the meantime, we encourage you to check out some of our resources for sharing inclusive content public, including: Audiences and Inclusion: A Primer for Cultivating More Inclusive Attitudes Among the Public and our Data Story “Beware! The False Consensus Effect.”
Annual Survey of Museum-Goers Data Stories are created by Wilkening Consulting on behalf of the American Alliance of Museums. Sources include:
• 2024 Annual Survey of Museum-Goers, n = 90,178; 202 museums participating
• 2024 Broader Population Sampling, n = 2,154
• 2017 – 2023 Annual Surveys of Museum-Goers
*Data Stories share research about both frequent museum-goers (typically visit multiple museums each year) and the broader population (including casual, sporadic, and non-visitors to museums).
More Data Stories can be found at wilkeningconsulting.com/data-stories.


