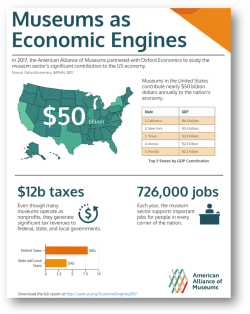
 While the Museums as Economic Engines – Full Report gives you all the detail you’ll need to understand the facts of museums’ economic contributions, sometimes you’ll only have just a few minutes to communicate how museums contribute job, value, and tax revenues.
To help out, we’ve created a series of one-page infographics that contain all the key facts in an at-a-glance format. These are great discussion starters and leave behinds intended to support your advocacy efforts.
Download the Economic Engines – National Infographic now! (PDF)

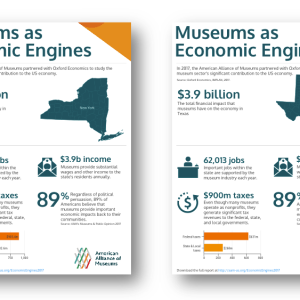
We also know that local data is often the most compelling. That’s way we’ve created state-by-state infographics for each state in the US. These one-pages are really valuable when communicating with stakeholders and lawmakers from your local community.
Use the dropdown menu to select your state and then download!


This is very helpful to us in making the case for funding. Thank you so much for not only providing the national data in the infographic, but customizing it by state. Super helpful!